Turn deal feedback into clearer decisions
At a Glance
My contribution: End-to-end product design across Module Settings, Integration Configuration, Aggregation Portal, Data Explorer, Deal Detail, Participant Detail, and the Feedback Report, in collaboration with the viaPeople dev team.
Challenge: Connect Client Success setup to automatic feedback cycles and make aggregated results useful across the deal portfolio and at deal, participant, and report levels.
Outcome: A connected experience that gives administrators a clear setup path and lets clients move from overall patterns to the detail needed for decisions.
From Settings to Client Value
DealTeam Feedback begins inside viaPeople. In Module Settings, a Client Success administrator enables the module, connects each client’s deal source, maps the cycle template, and checks integration status. Once set up, DealTeam Feedback runs feedback cycles automatically and aggregates data from active and completed cycles. A company administrator can trigger a cycle manually when needed and use the Aggregation Portal to move from overall results to a detailed view of a deal or participant.
Client Success workflow
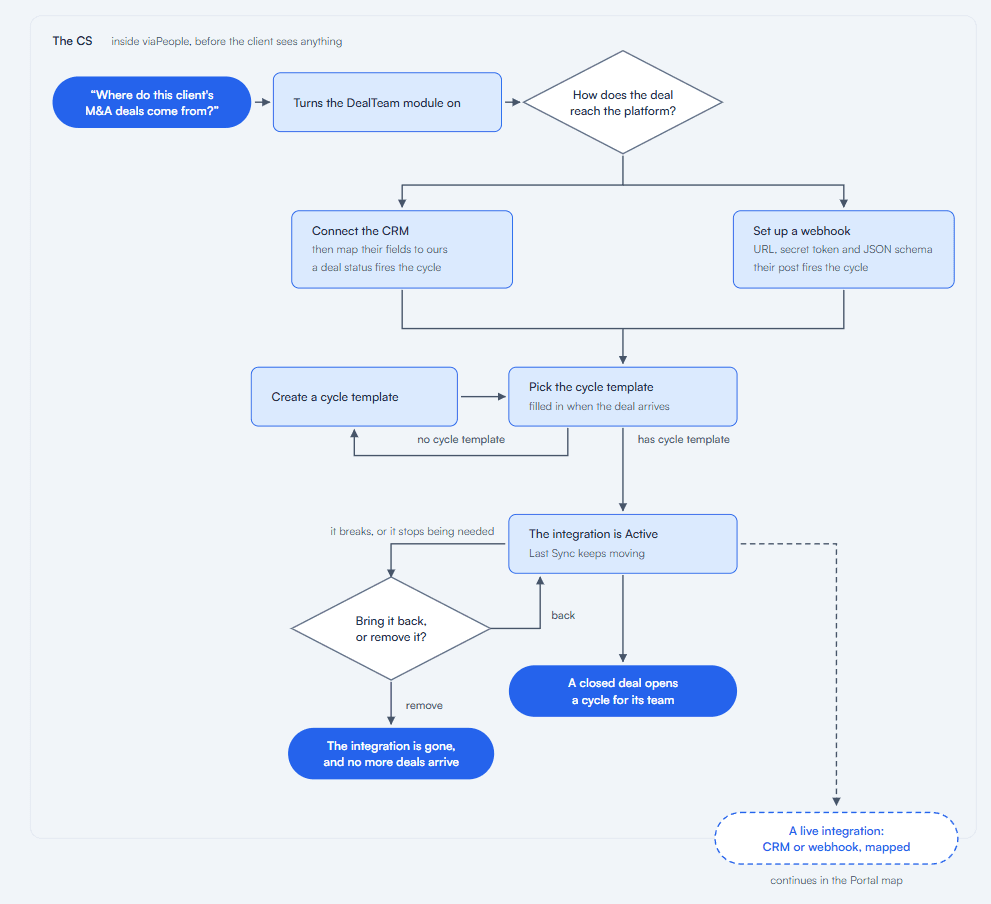
Client Success owns activation, source setup, mapping, and integration status.
Client workflow
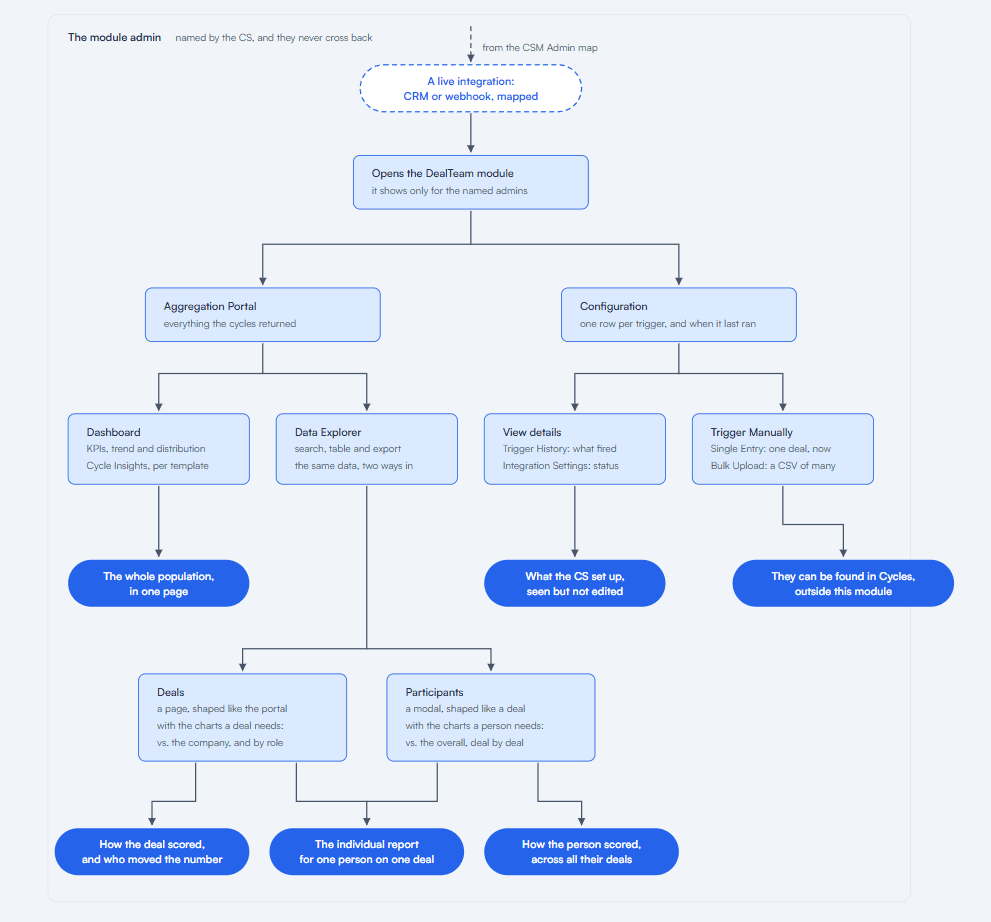
The client enters after configuration and works with feedback, deals, participants, and reports.
Installation Stayed Inside One Frame
The Modules page moved from a list to a card layout. Each module became its own card, with an enable switch and separate “View” and “Configure” actions. Placing the switch on the right aligned it with the title and description. The off state used a white track and dark thumb, so it remained clickable without being confused with disabled.
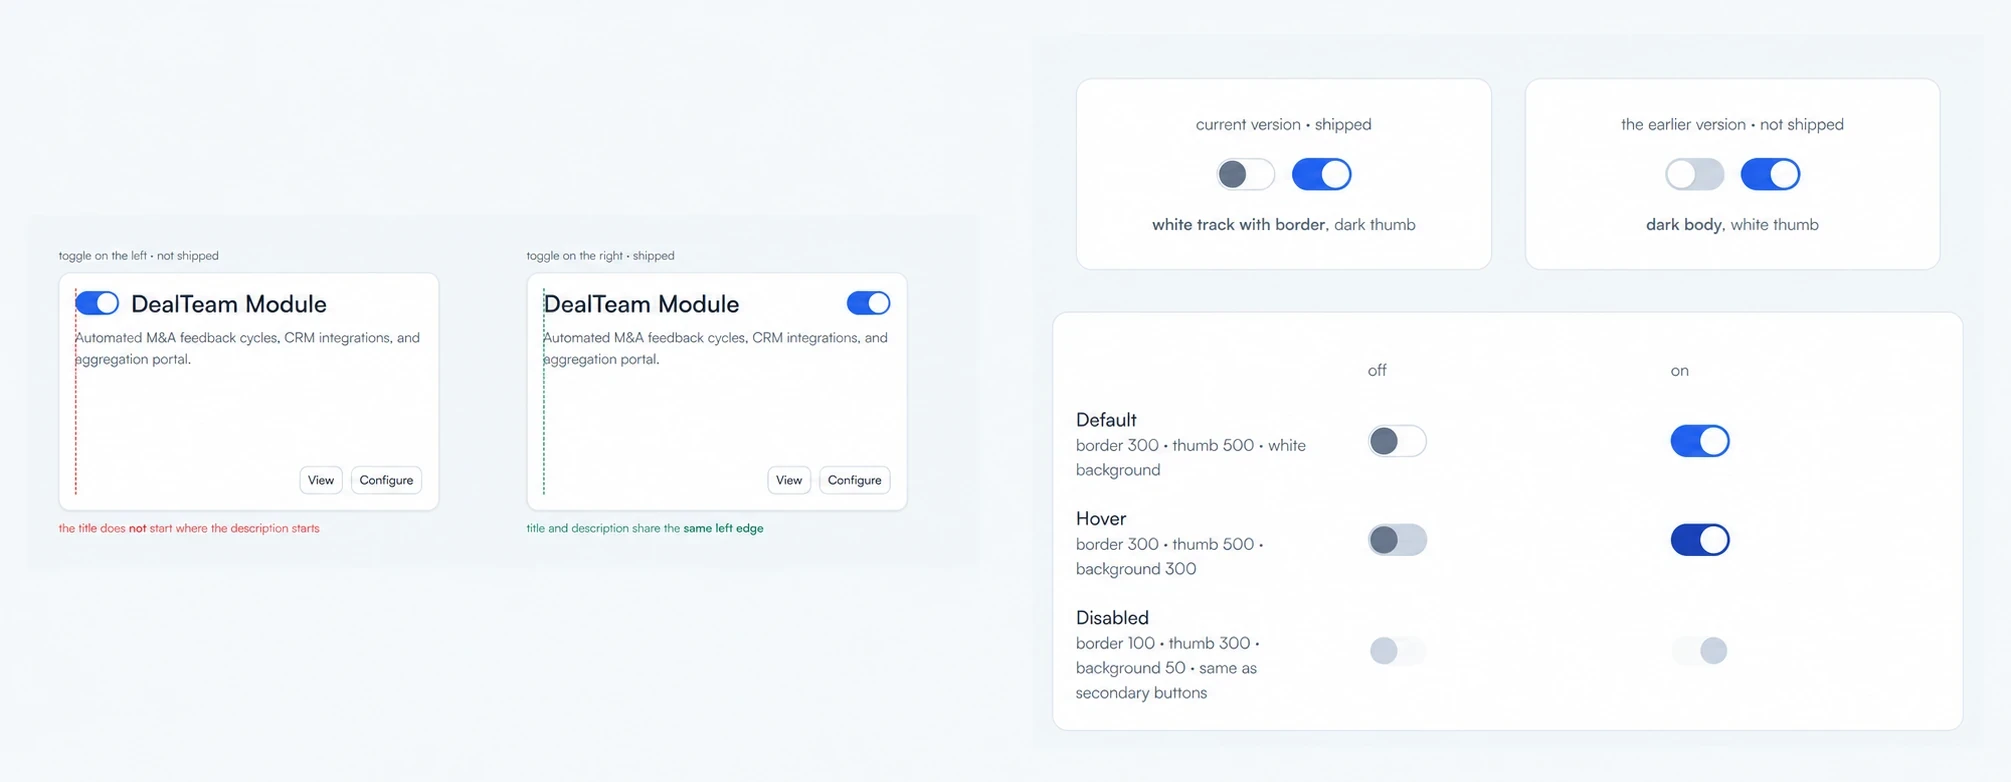
Both states preserve access to “View” and “Configure”. The switch only changes whether the module is on.
Module configuration keeps the entire setup inside one modal. The flow first separates the “CRM Integration” and “Webhook” paths, then handles column mapping, optional fields, endpoint setup, and cycle-template prerequisites. When a cycle template is missing, the banner link opens a new browser tab where Client Success can create one. The configuration modal remains open in the original tab.
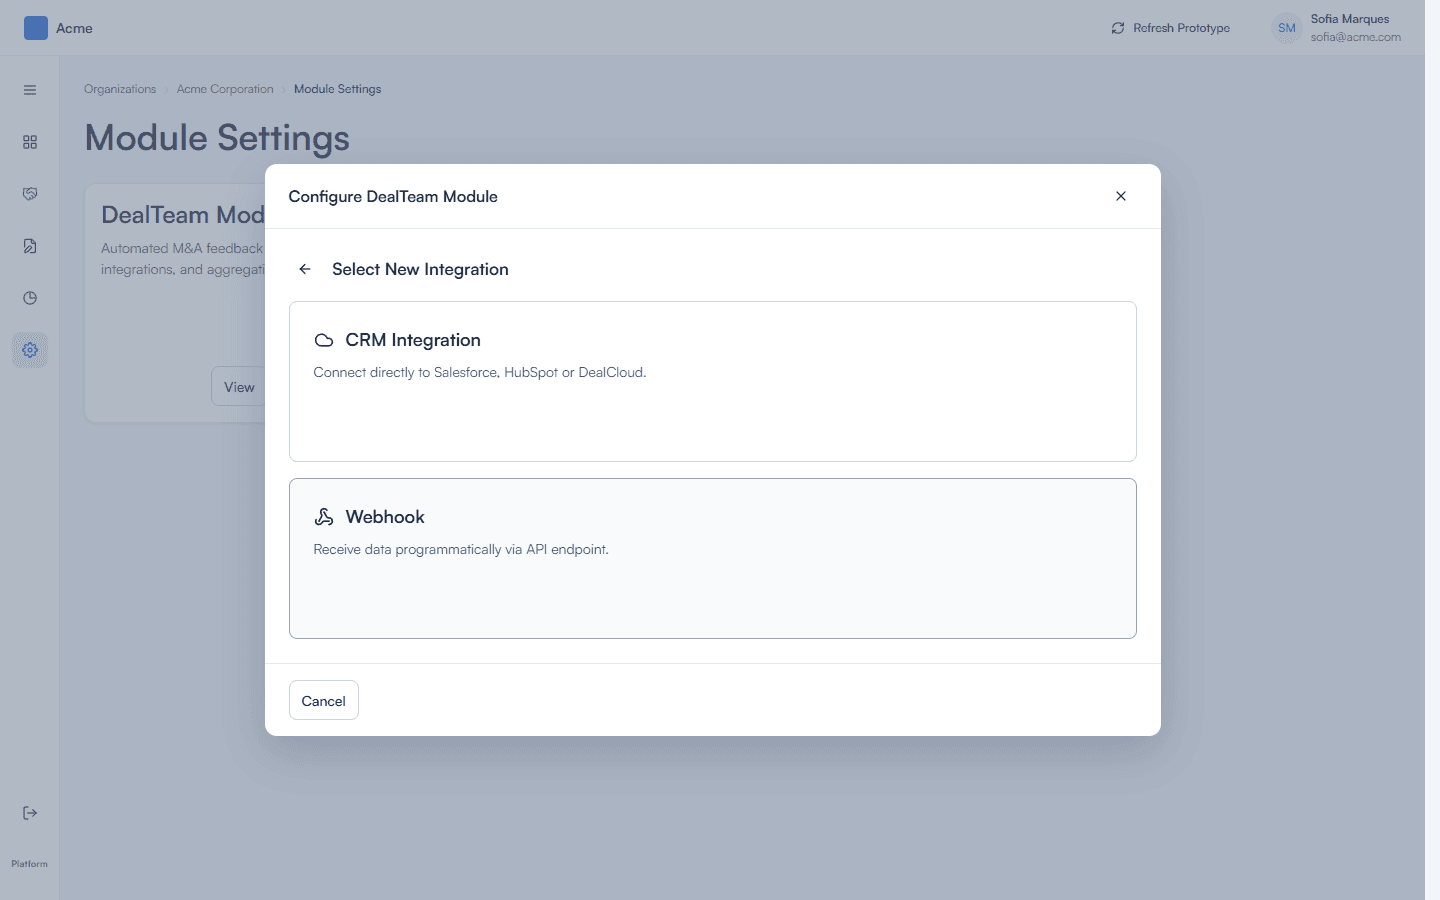
Client Success chooses “CRM Integration” or “Webhook”, then completes the setup required for that integration.
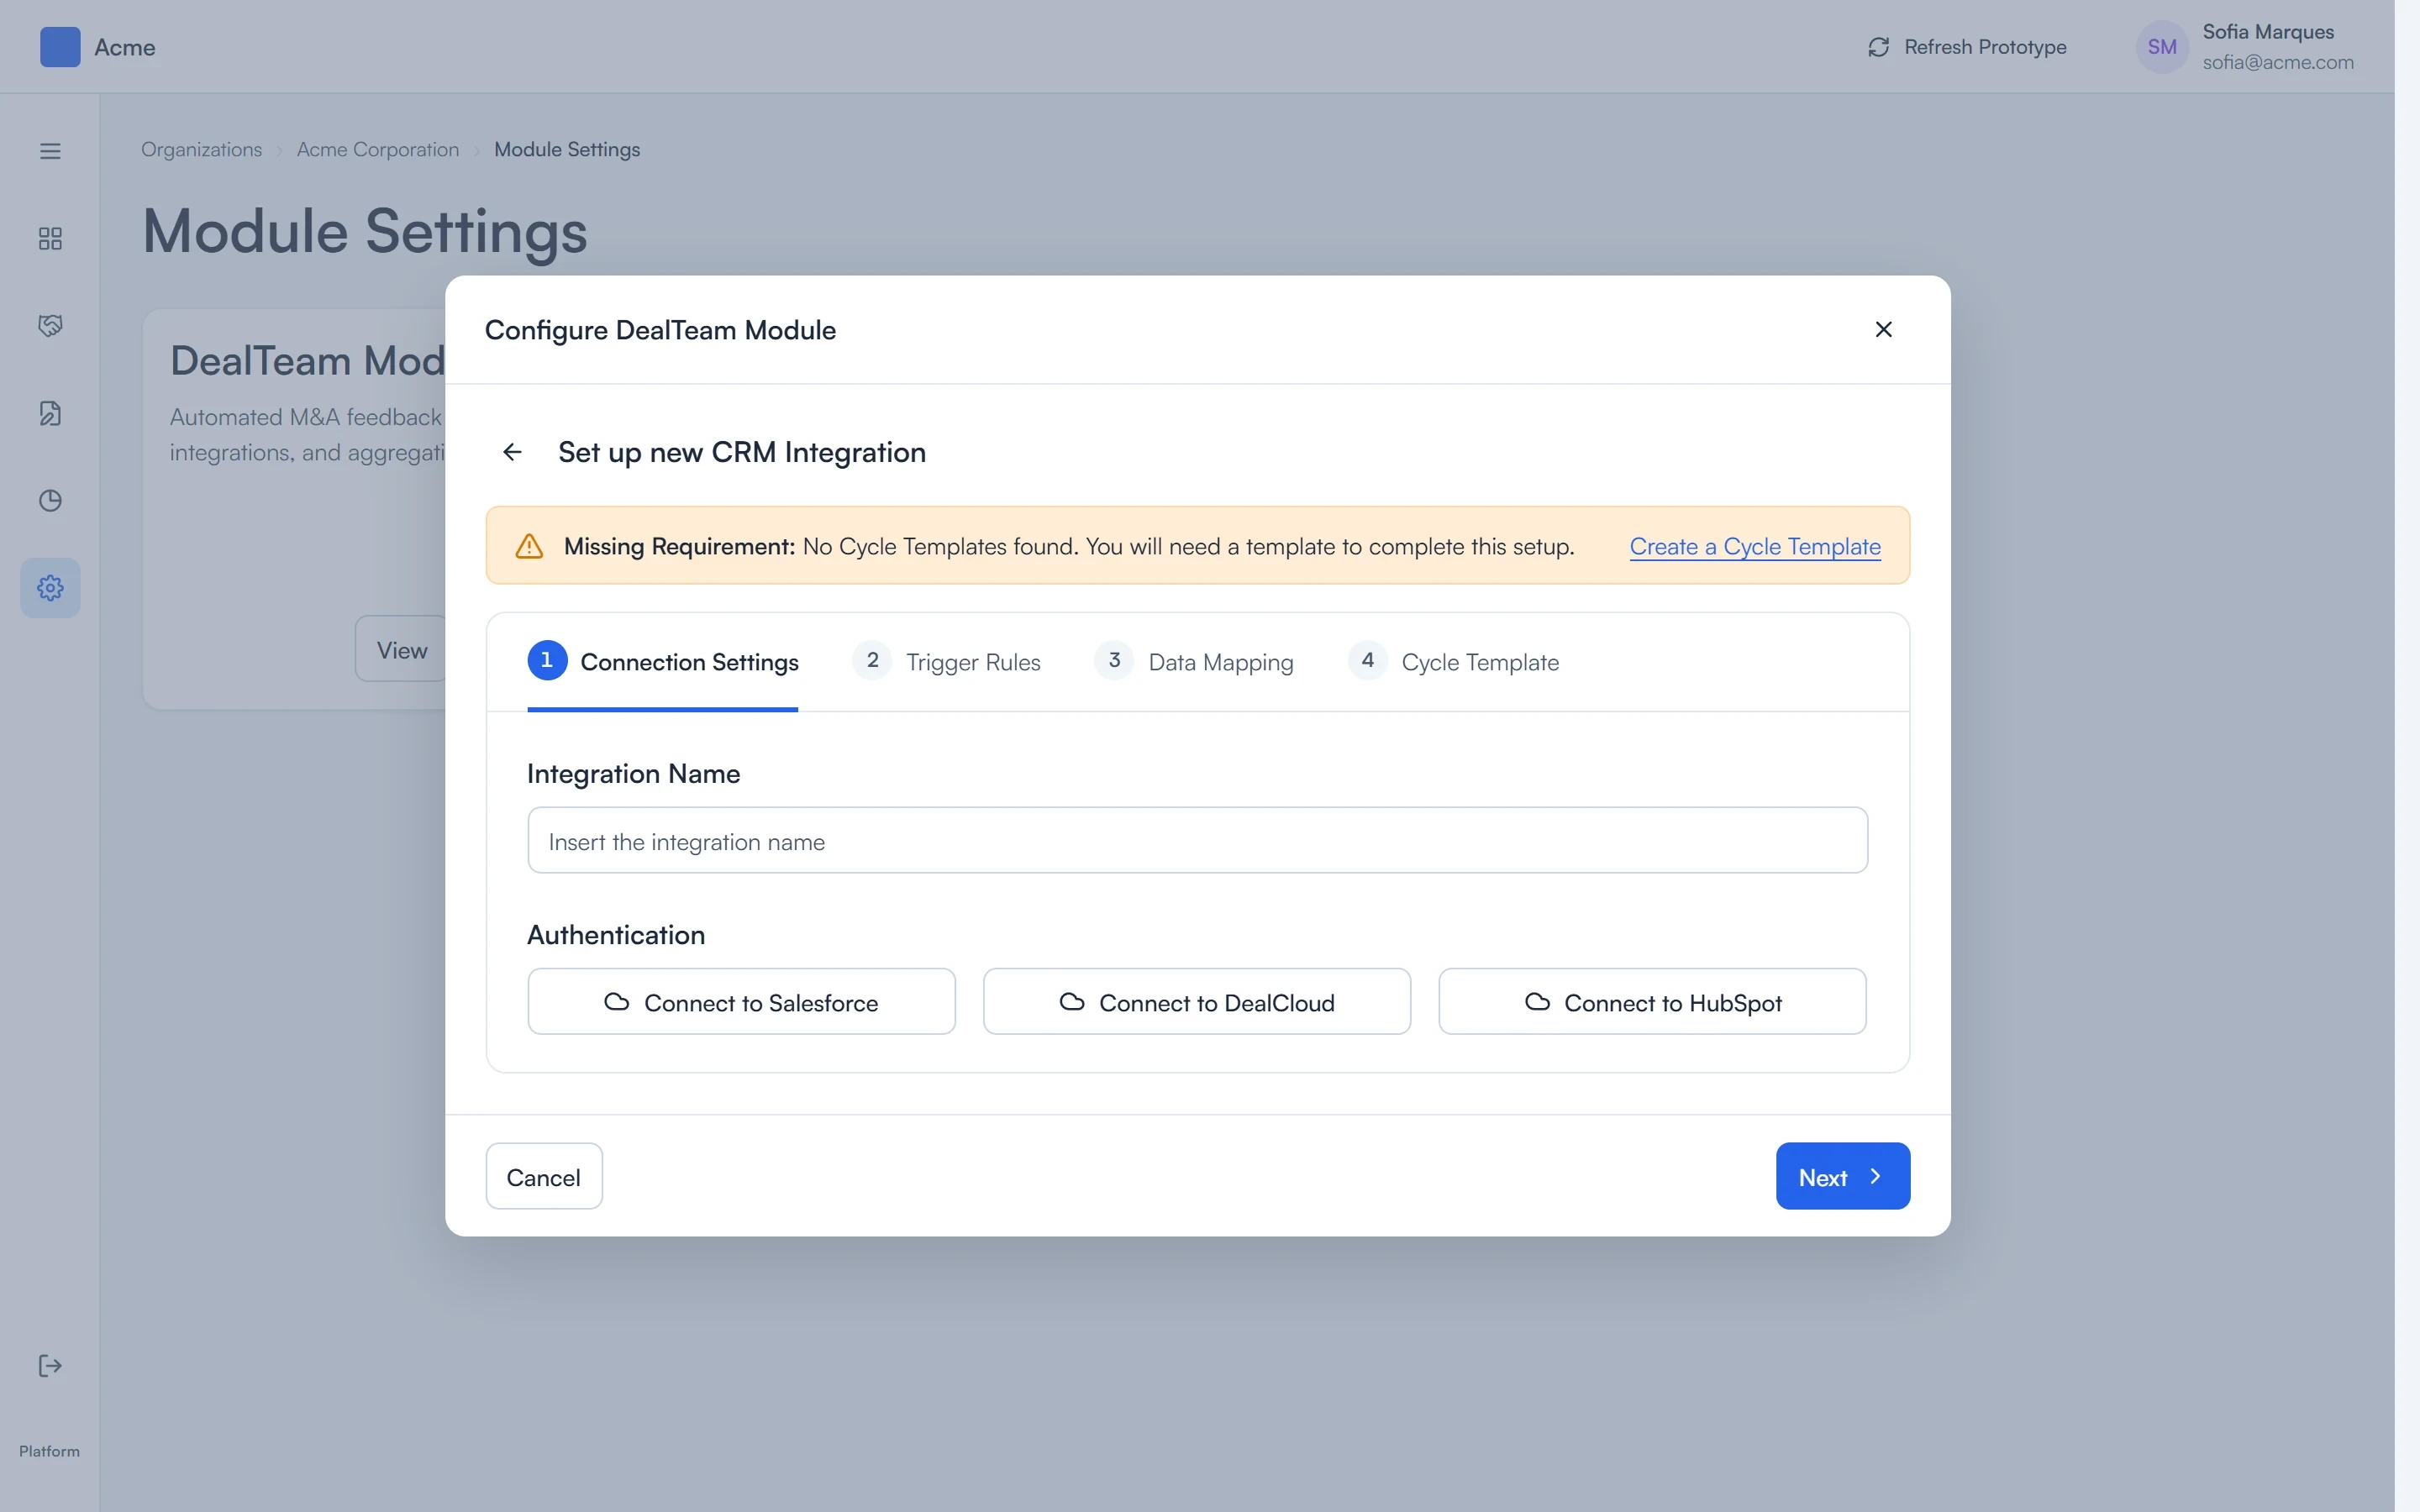
The prerequisite is visible before Client Success proceeds with the selected integration path.
The webhook step had to distinguish technical content without making the panel feel heavier than the rest of the form. A monospaced typeface marks the shift to code across the JSON block, webhook URL, and secret token. The surrounding surfaces remain light and consistent with the rest of the setup.
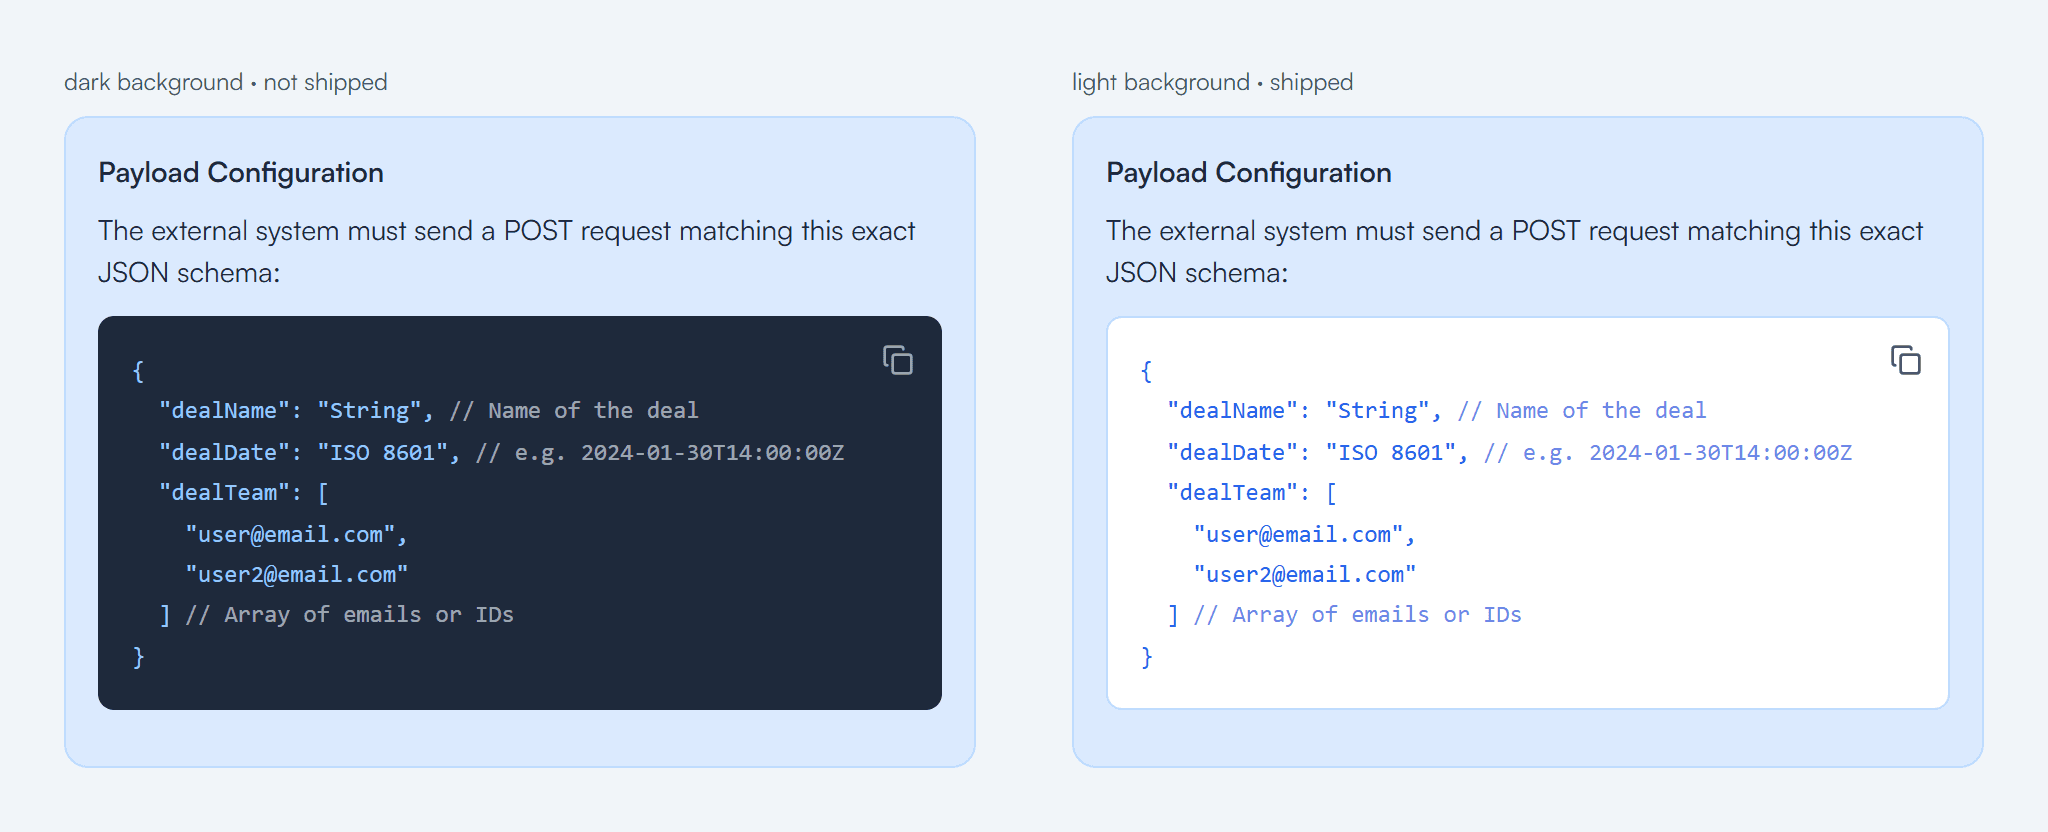
Typography identifies technical content while the surface remains consistent with the surrounding form.
Consequences Shape Confirmation
The action column follows the three button levels defined in the Discover design system. Recovery actions receive primary emphasis because they restore a stopped connection. “Pause” remains an outlined destructive action. “Edit” and “Delete” were reduced to icon-only controls to keep the table compact.
“Pause” is reversible, so it uses a compact popconfirm beside the row. “Delete” is permanent, so it opens a dedicated modal. The confirmation pattern reflects both consequence and reversibility.
Action hierarchy
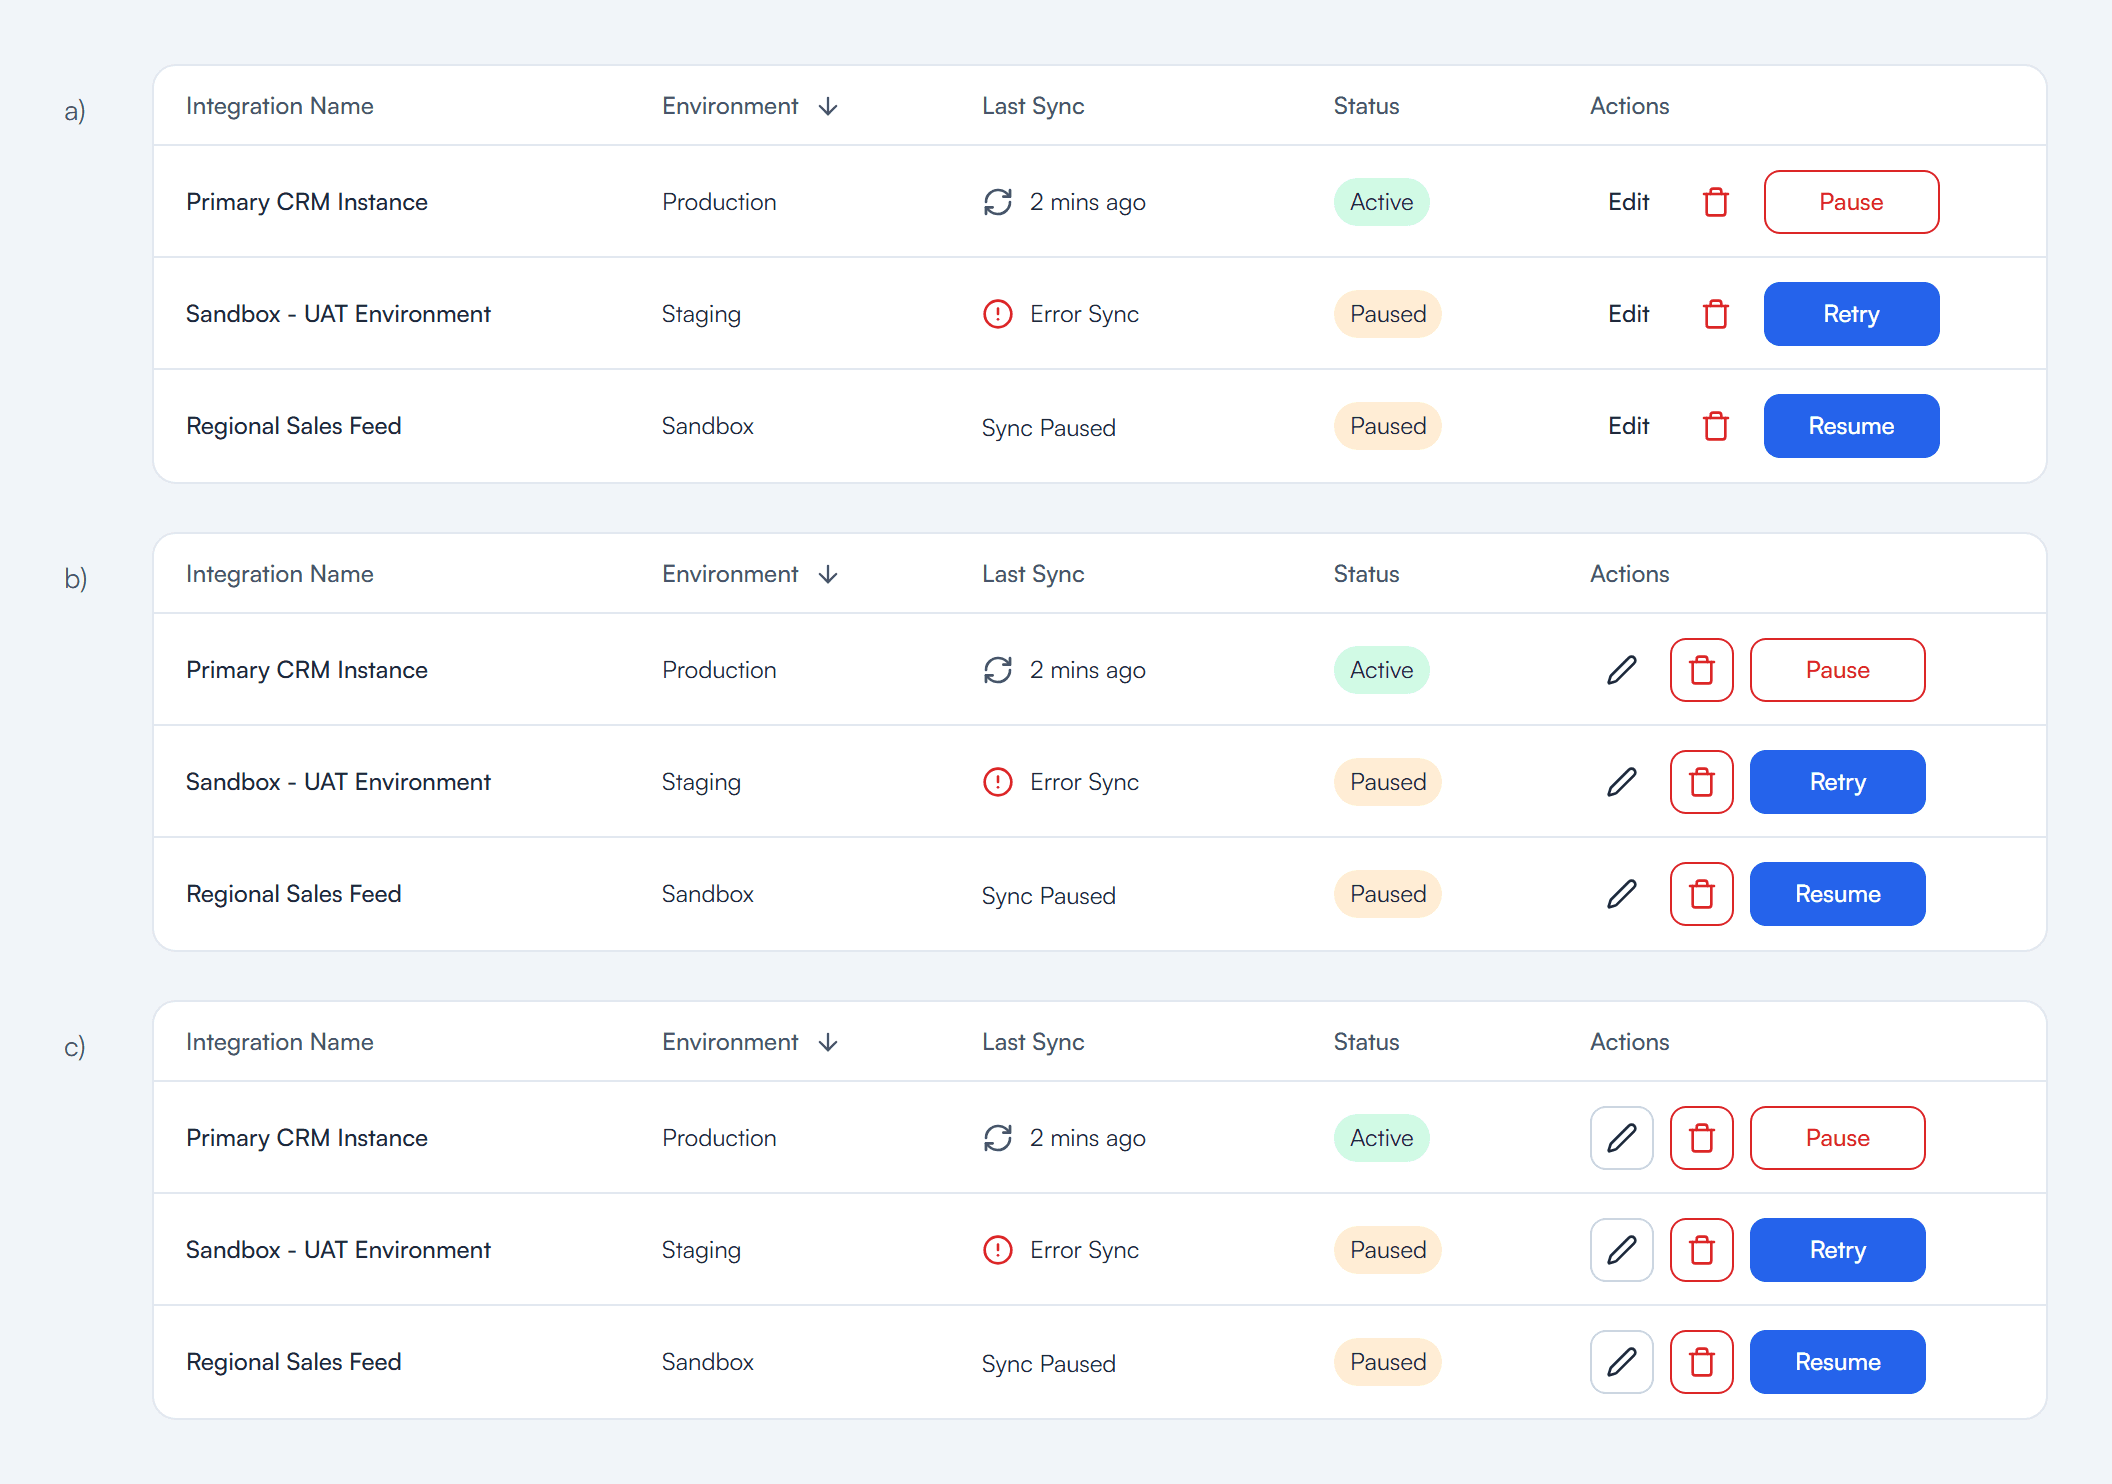
The same hierarchy remains clear as the action column moves from labels to icons.
Confirmation scale
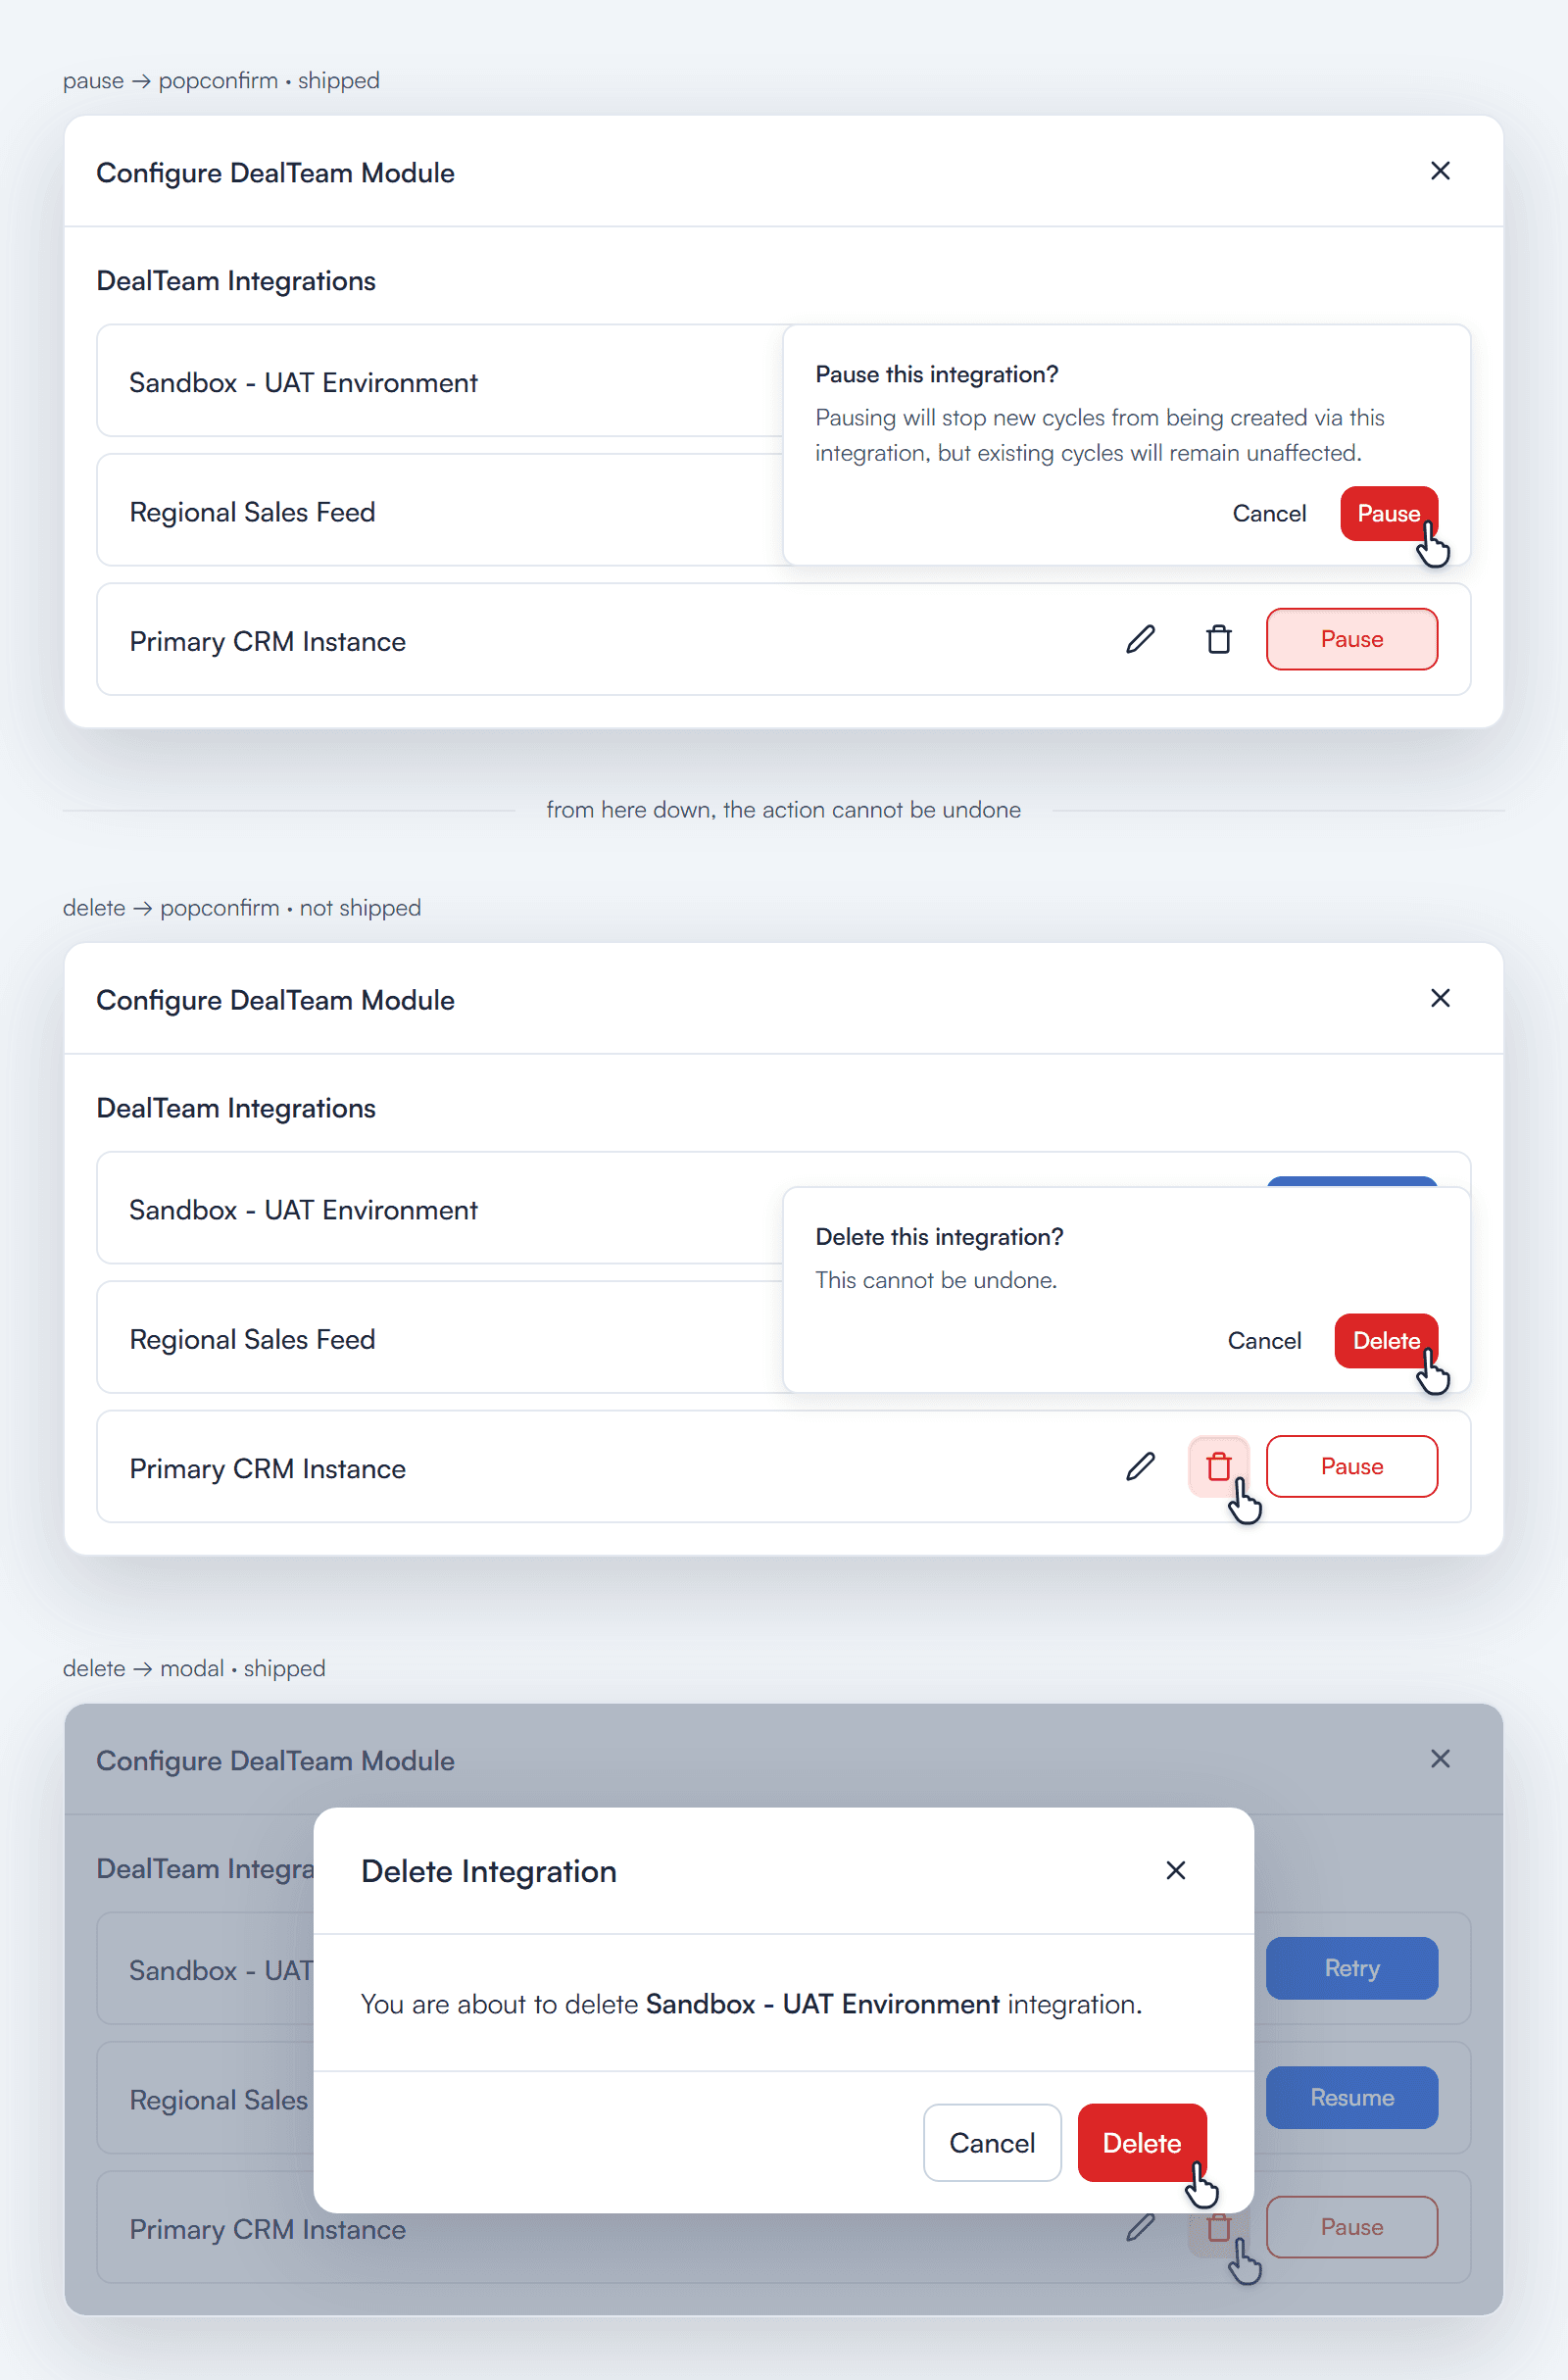
Reversible and permanent actions receive different levels of interruption.
From the Big Picture to the Participant Behind It
Configuration shows the client its established CRM or webhook connection and the history of previous triggers. Feedback cycles run automatically once the module is configured. If a company administrator chooses to trigger a cycle manually, “Single Entry” adds one deal and “Bulk Upload” adds multiple deals through a CSV with column mapping.
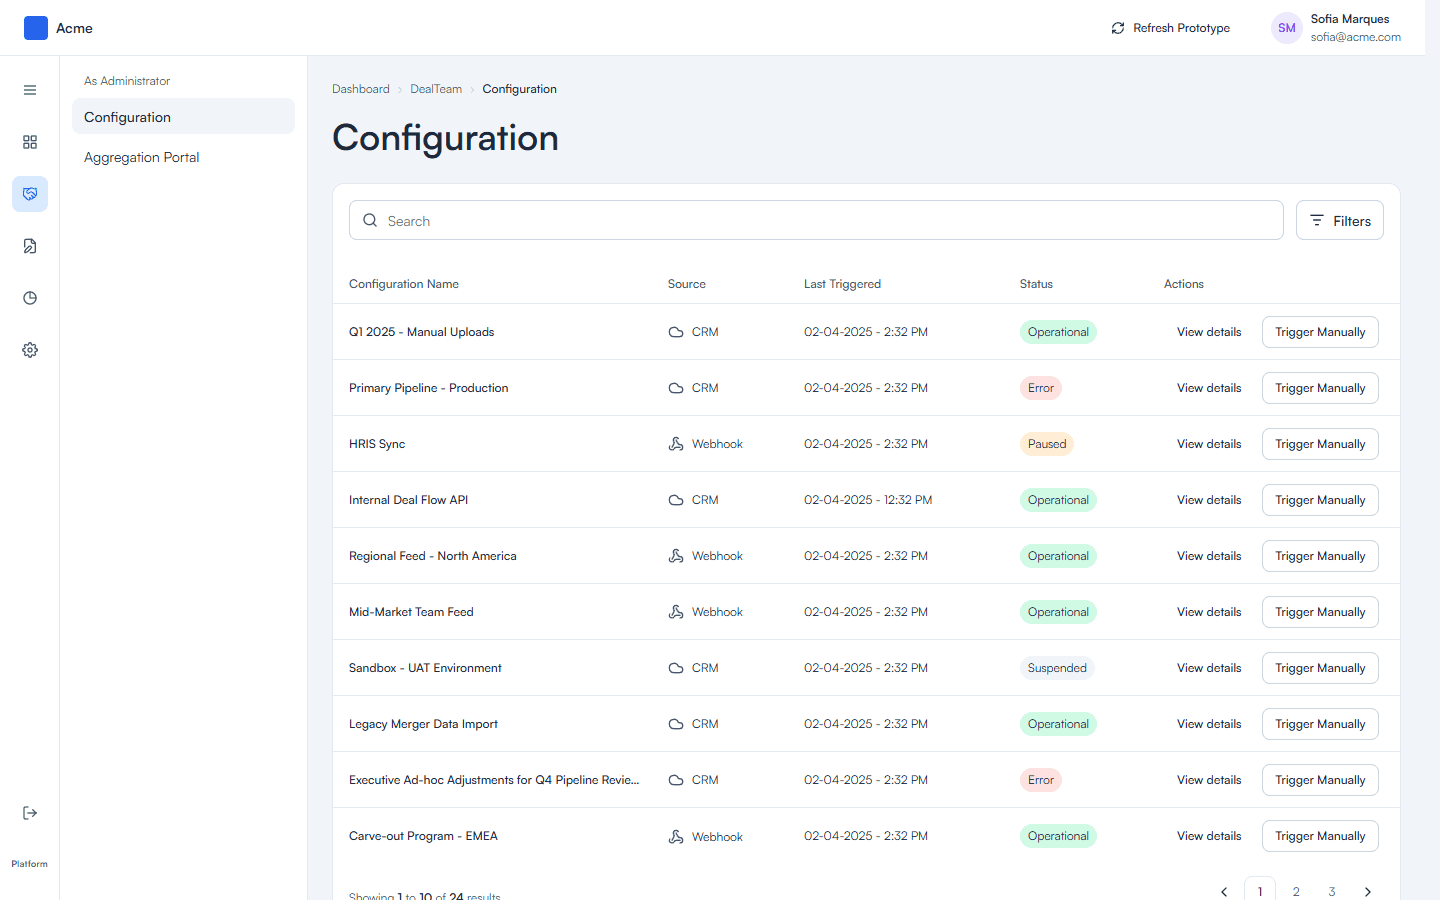
Manual triggering is optional. “Single Entry” and “Bulk Upload” differ by the volume of deals entered at once.
The Aggregation Portal opens with a combined view of results across deals and participants. KPI cards track average rating, active deals, completion rate, and active participants. Performance Trend compares average, highest, and lowest ratings across quarters. Overall Distribution shows how participants spread across five rating bands. Cycle Insights compares results by item across feedback rounds built from the same cycle template.

The dashboard connects movement over time, the spread of ratings, and the questions behind both.
The distribution pattern also appears in Report & Talent Heatmap, preserving a familiar reading model that can scale across other viaPeople modules.
Data Explorer turns the overview into a working list. Deals shows close date, participants, overall rating, and the highest-rated participant. Participants shows role, deals involved, average score, and highest-rated deal. Search, filters, selection, and export remain available in both views.
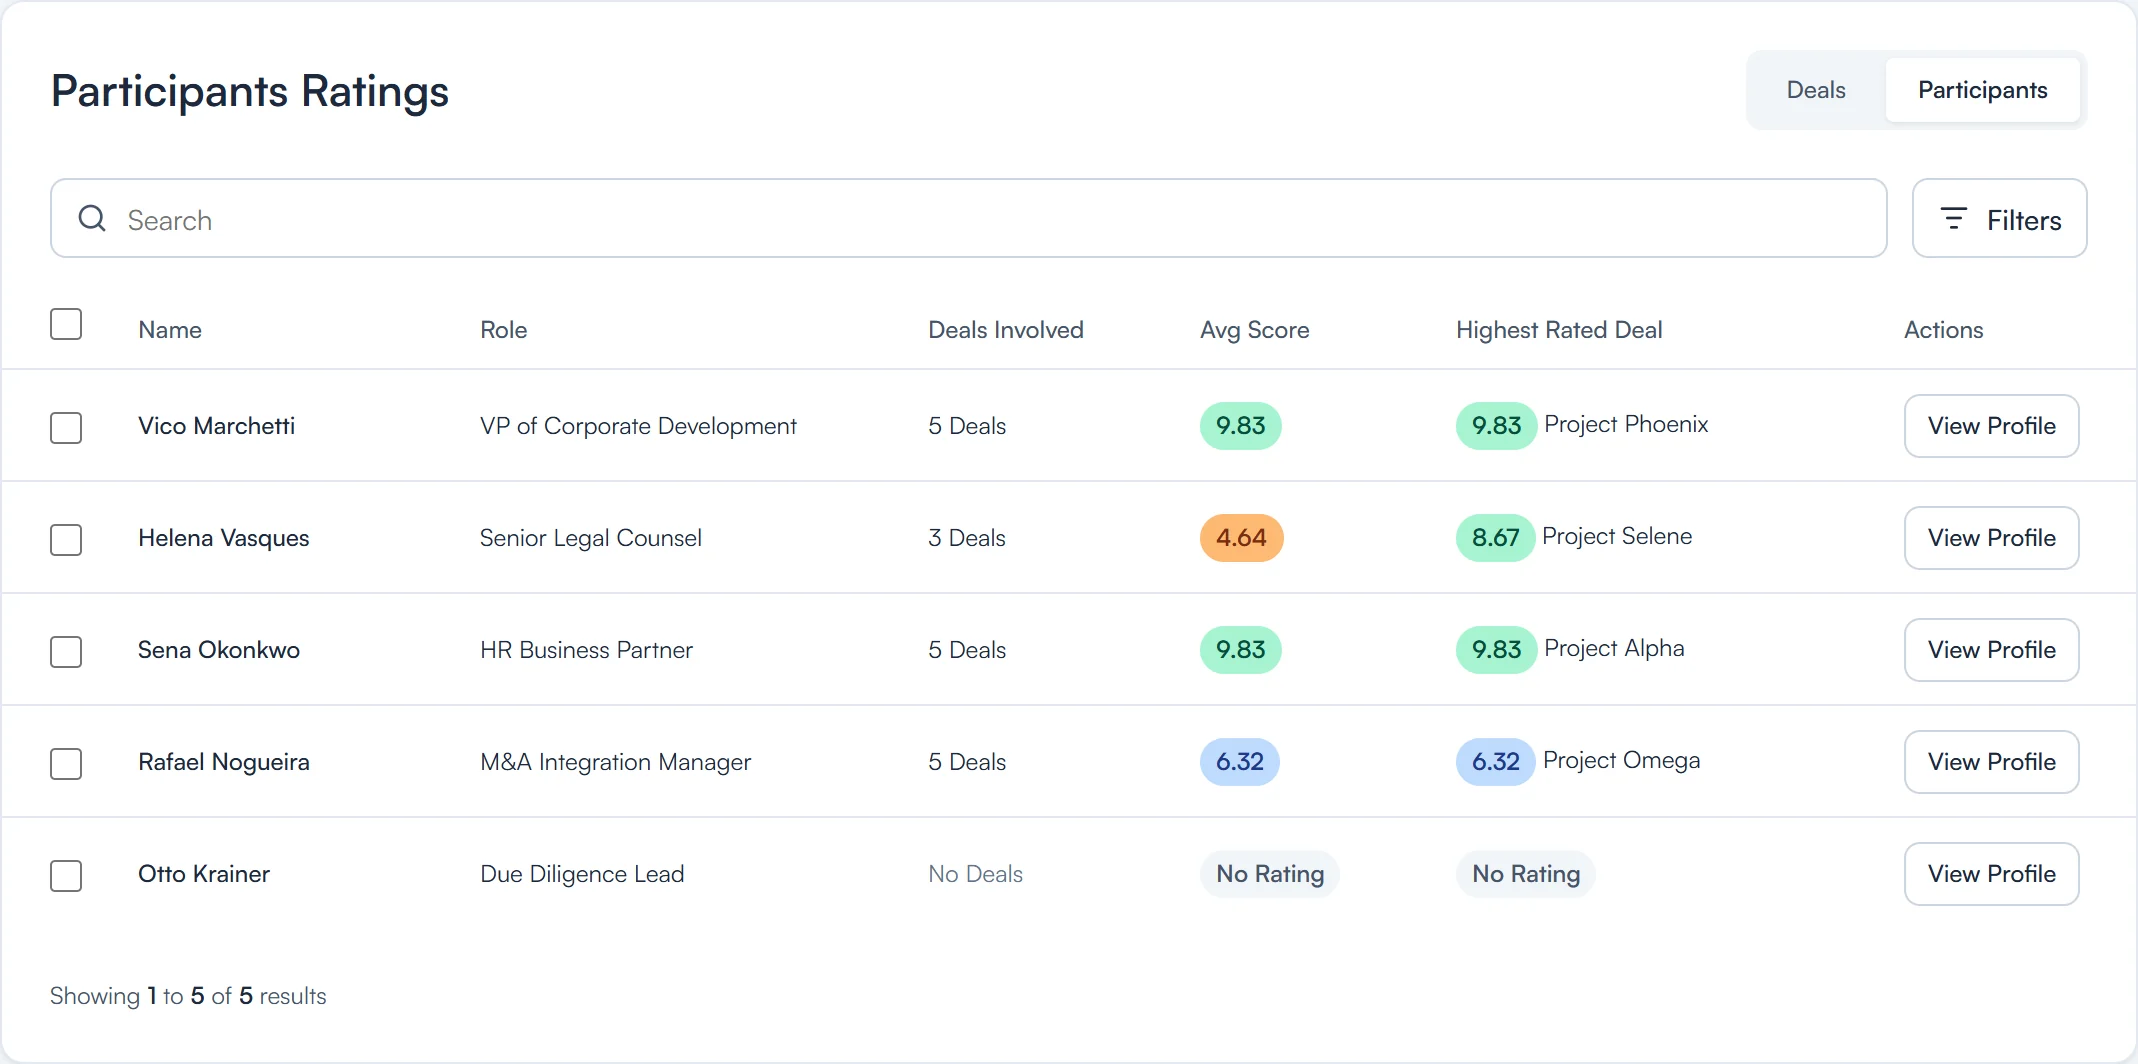
Deals and Participants provide two entry points into the same feedback data.
Across Data Explorer and the detail views, a five-step rating pill keeps every score on the same visual scale. Color communicates the range, while the number carries the exact value.

The color identifies a score range consistently across cards, tables, charts, and reports.
Deal Detail keeps the aggregated context visible while the client moves into a specific deal. The summary identifies the strongest and weakest participants. Deal Performance compares the deal with company benchmarks, breaks the score down by role, and places a participant table directly below Rating Distribution. Performance by Question shows the rating distribution and summary values for every item in that specific cycle form.
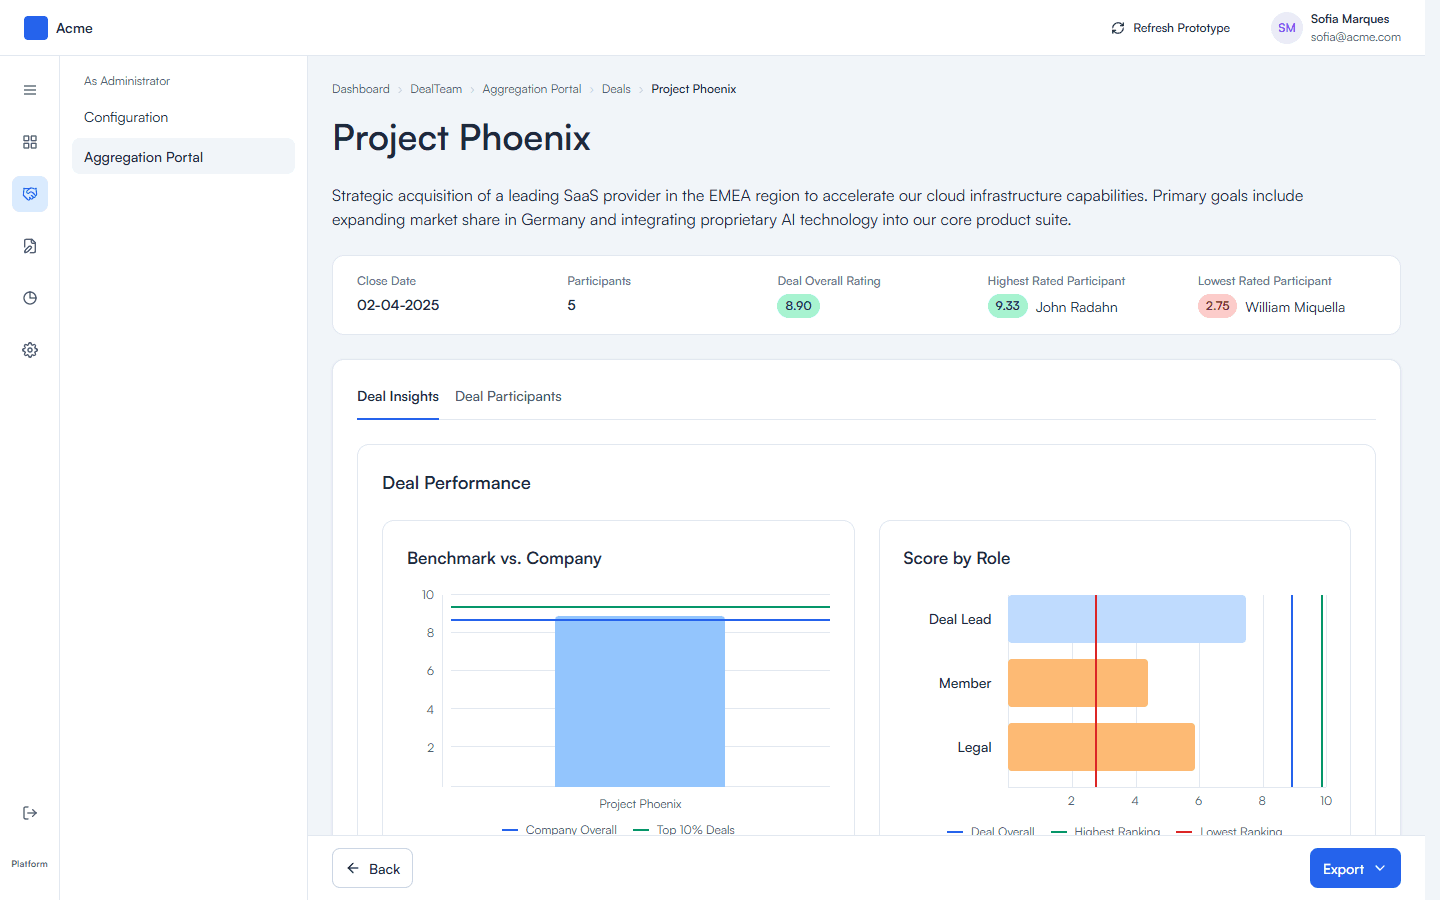
The page moves from deal-level benchmarks to the participant and question evidence behind the result.
A Profile Opens Without Breaking Context
“View Profile” opens a participant’s record in a modal from any context where that profile is available. DealTeam Profile summarizes identity, manager, deals involved, completion rate, average rating, performance trend, and rating distribution. Deal History provides the deal-level record behind those totals.
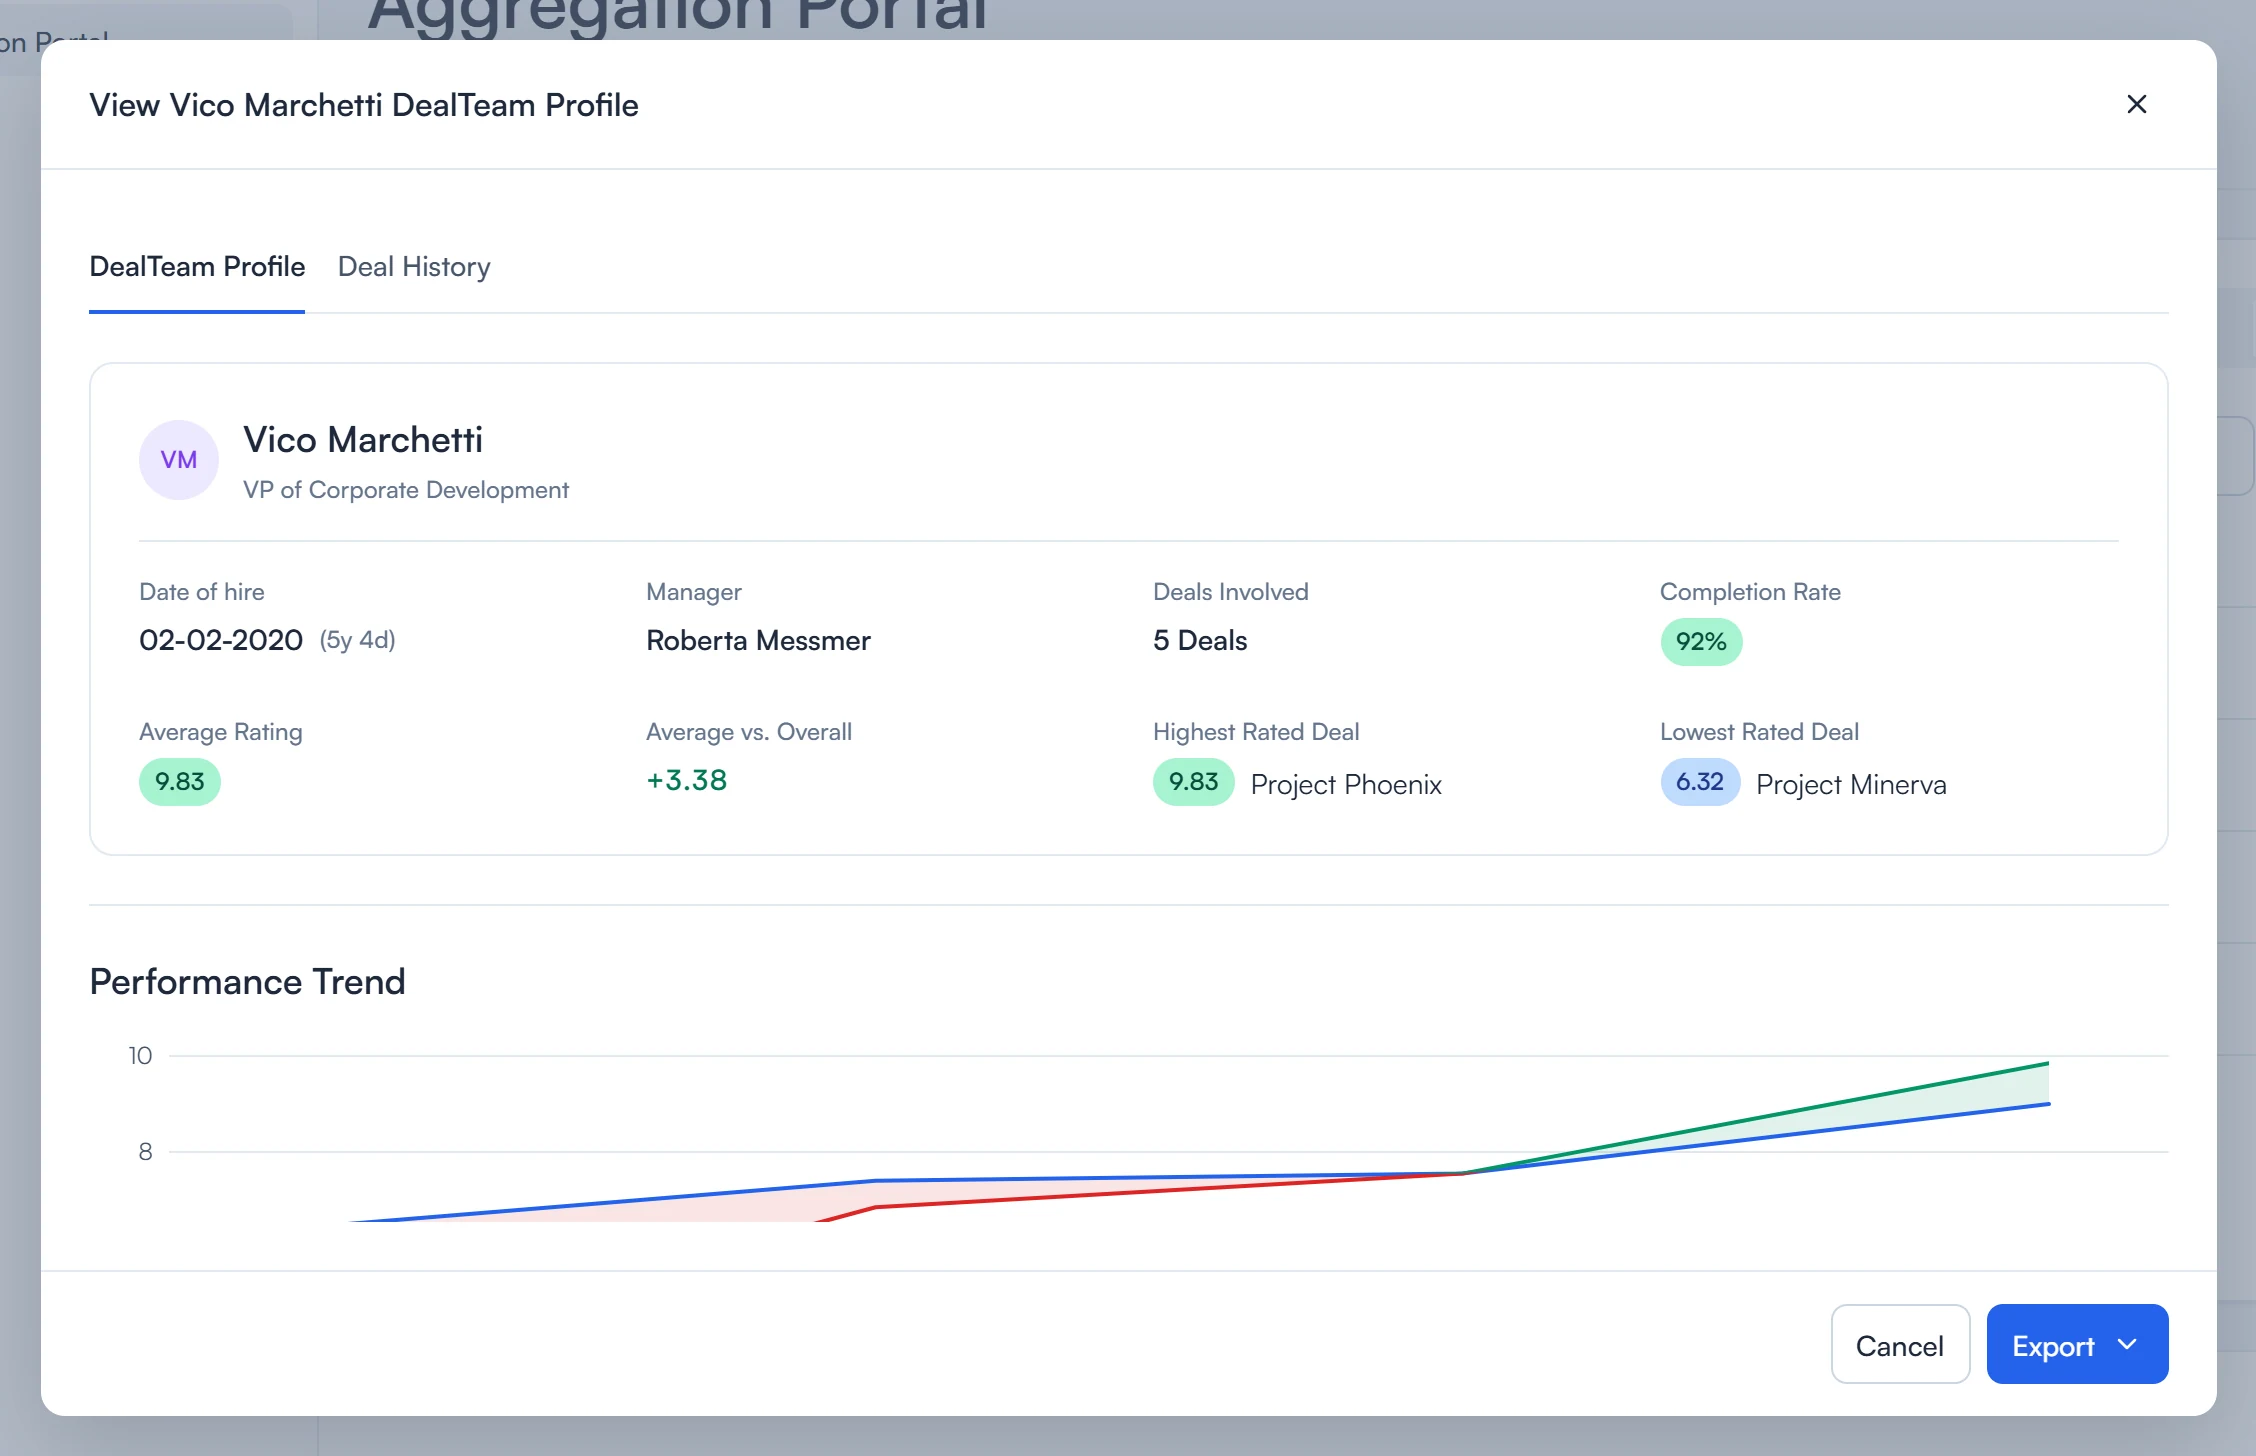
The modal adds participant detail without taking the client away from the current context.
The PDF Set the Direction
Four structures were explored for the individual report. The third direction used the exported PDF report more efficiently while keeping each question’s scale visible. The layouts were tested with qualitative and quantitative scales to compare how each structure handled both kinds of response. The selected table made the answers easier to scan while fitting more reviewers on the page.
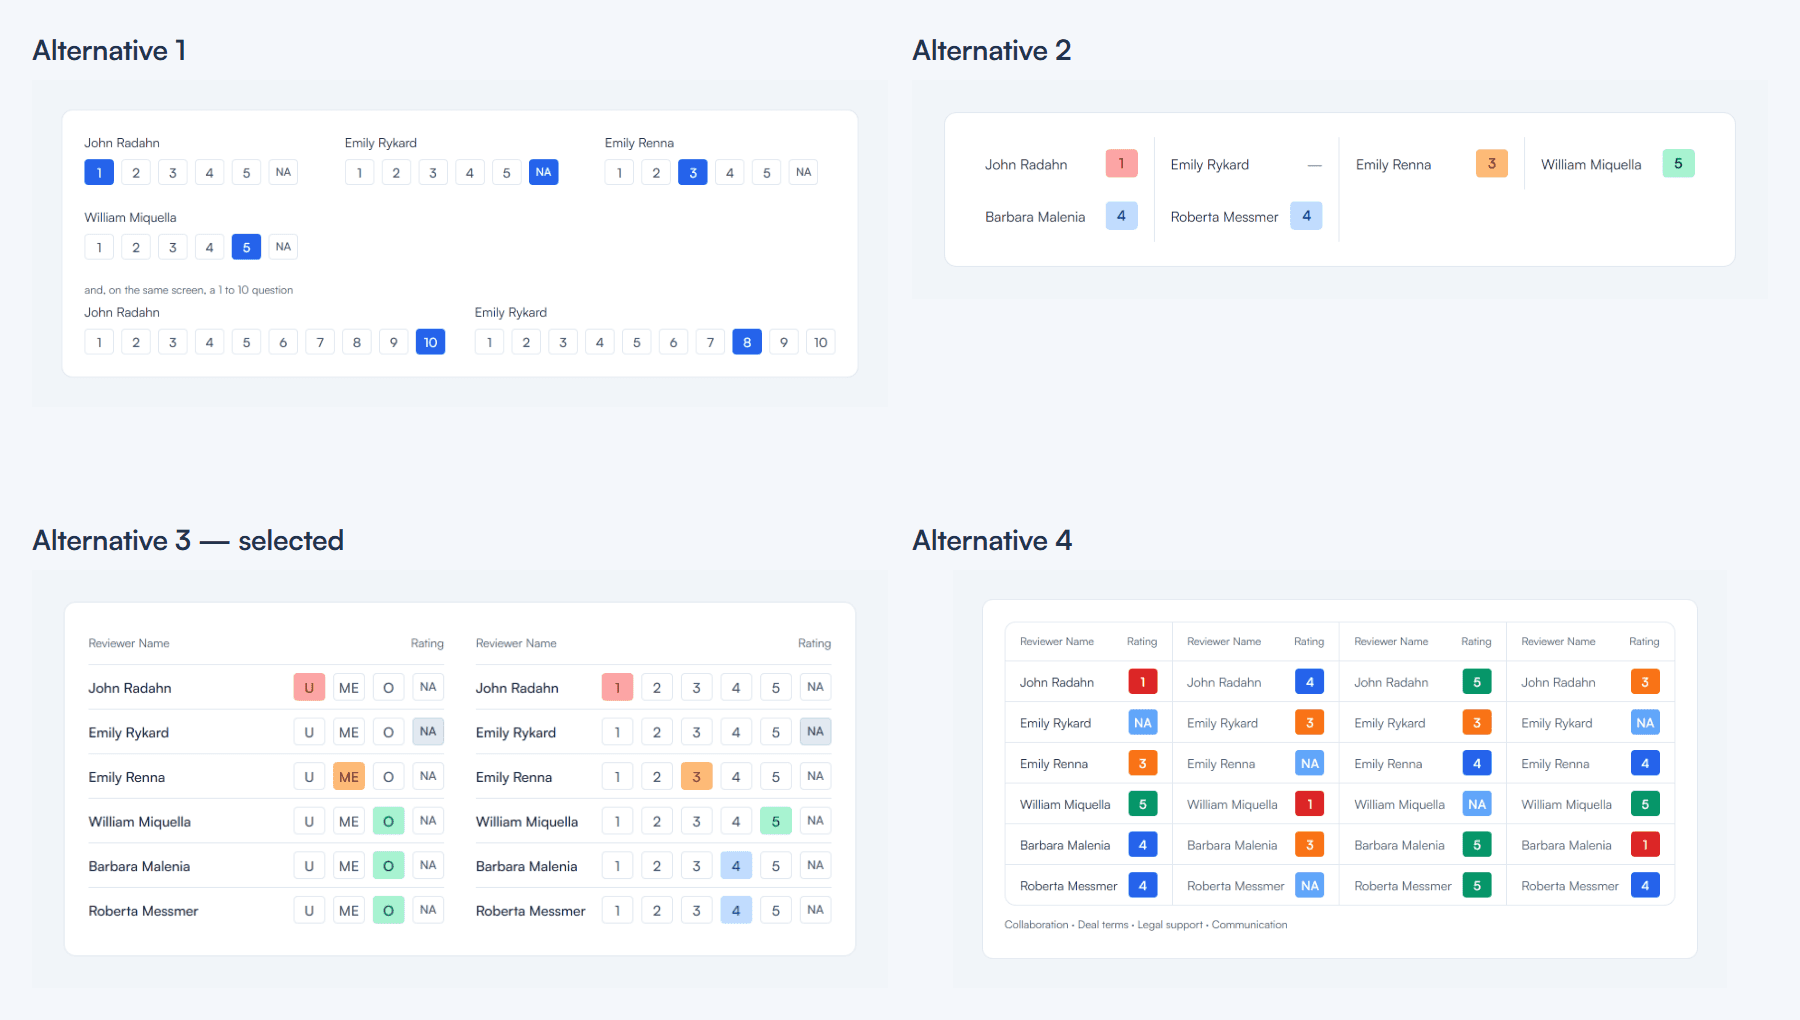
The selected layout fits the exported PDF report more efficiently and reduces the number of pages required.
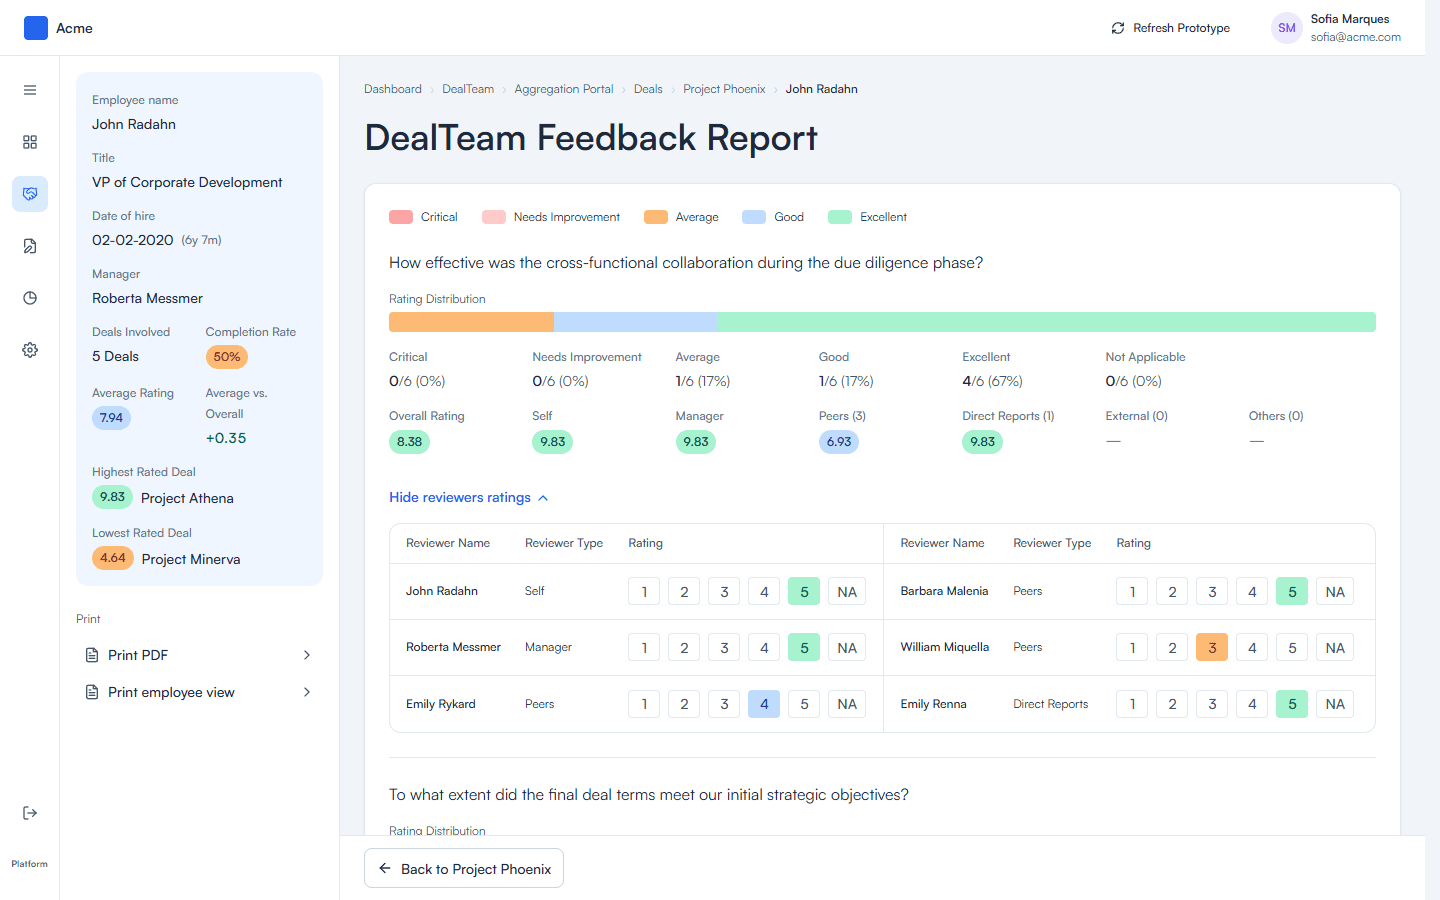
The final report keeps participant context and print actions in the side panel, then uses a table to compare each reviewer’s answer with the scale used for that item.
Explore DealTeam Feedback
Open each prototype independently. In Client Success, inspect Module Settings. In Client, begin with Integration Configuration, then move through Aggregation Portal, Deal Detail, and Feedback Report.
Client Success
Module settings
Client
Integration configuration
Aggregation portal
Deal detail
Feedback report
viaPeople, its product, and the interfaces shown in this case belong to viaPeople. This portfolio presentation is a reconstruction based on the original designs, using fictional data to protect confidential information.